Summary of the project, product, framework
Asset information driven risk modelling & visualisation was enhanced in two ways; firstly, inspection and failure data were used to develop information-based survival curves for wood pole assets; and secondly, data visualisation dashboards were developed using Qlik to enable asset managers to respond to queries in minutes rather than days.
Description of project or framework addressing the assessment criteria
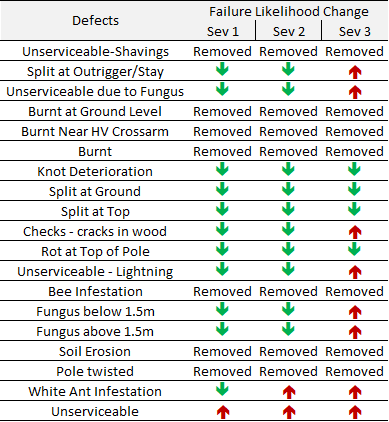
Wood pole survival curves
Western Power’s network has a wide variety of wood pole species in its network, each presenting its own challenges with respect to asset condition monitoring, ageing phenomenon, failure modes and consequences from their performance. As a part of this project a cross functional team of data analytics, wood experts and asset management practitioners developed survival asset models that were then put to use for asset management decision making and investment planning/ prioritisation.
Benefits:
- Accurately quantify and model risk to customers, workforce and the community over time from the Western Power Network;
- Prudent asset management decision making;
- Optimisation and prioritising asset replacement;
- Supports the articulation of risk of asset failure (likelihood and consequence);
- Provides a transparent, auditable, repeatable and defensible basis for funding requests and business planning;
- Enhances business understanding of network risk profile today and into the future; and
- Risks can be aggregated and visualised within GIS platforms.
Application:
- Zone based work selection guided by risk reduction per dollar spent;
- Enable selection and ranking of suburbs for undergrounding projects;
- Discussion with insurers; and
- Articulate network risk and performance outcomes for different funding scenarios.
Quantification:
- Use failure data coupled with expert opinion to inform survival curves
- Estimate failure probabilities from asset specific data and observable variables obtained from inspection data
- Geo-specific attributes used to inform both likelihood and consequence of asset failure

Asset information visualisation
An example of how we used to derive information from data was when the Energy Minister requested how many assets required treatment in his electorate.
Just a few years ago, Western Power Asset Managers requested data extracts on Asset Information from the Data Management Team which would require 2 days turn to receive data (Excel or Access) and then take another 1-2 days to analyse and respond. The elapsed time to respond was generally one to one and a half weeks.
This was subsequently improved via the development of “Information Packs”, a complex Access database and excel spreadsheet built for each asset class. This reduced query response times down to approx. 3 days and 1-2 days effort (but data could be 12mths old).
Our most recent advance in this evolutionary process is the development of an Asset Management Data Warehouse and data visualisation tool (Qlik) which enables asset managers to respond to queries with less than 5mins effort and under 30mins of elapsed time. The data is snapshotted monthly or if required could be amended to daily if required. And we know the accuracy and provenance of the information as it has originated from corporate systems, not the customised query scripting (data extract) as was the case previously.

Opinion as to specific contribution made by the nominated individual/team/organisation
In the space of just 5 years Western Power has evolved its asset information driven risk modelling & visualisation from being capable of:
- responding in 2 weeks down to less than 30 minutes;
- moved from MS Excel to MS Access to Qlik Enterprise data visualisation tool; and
- Implemented a reliable and repeatable tool.